What is GAPSim?
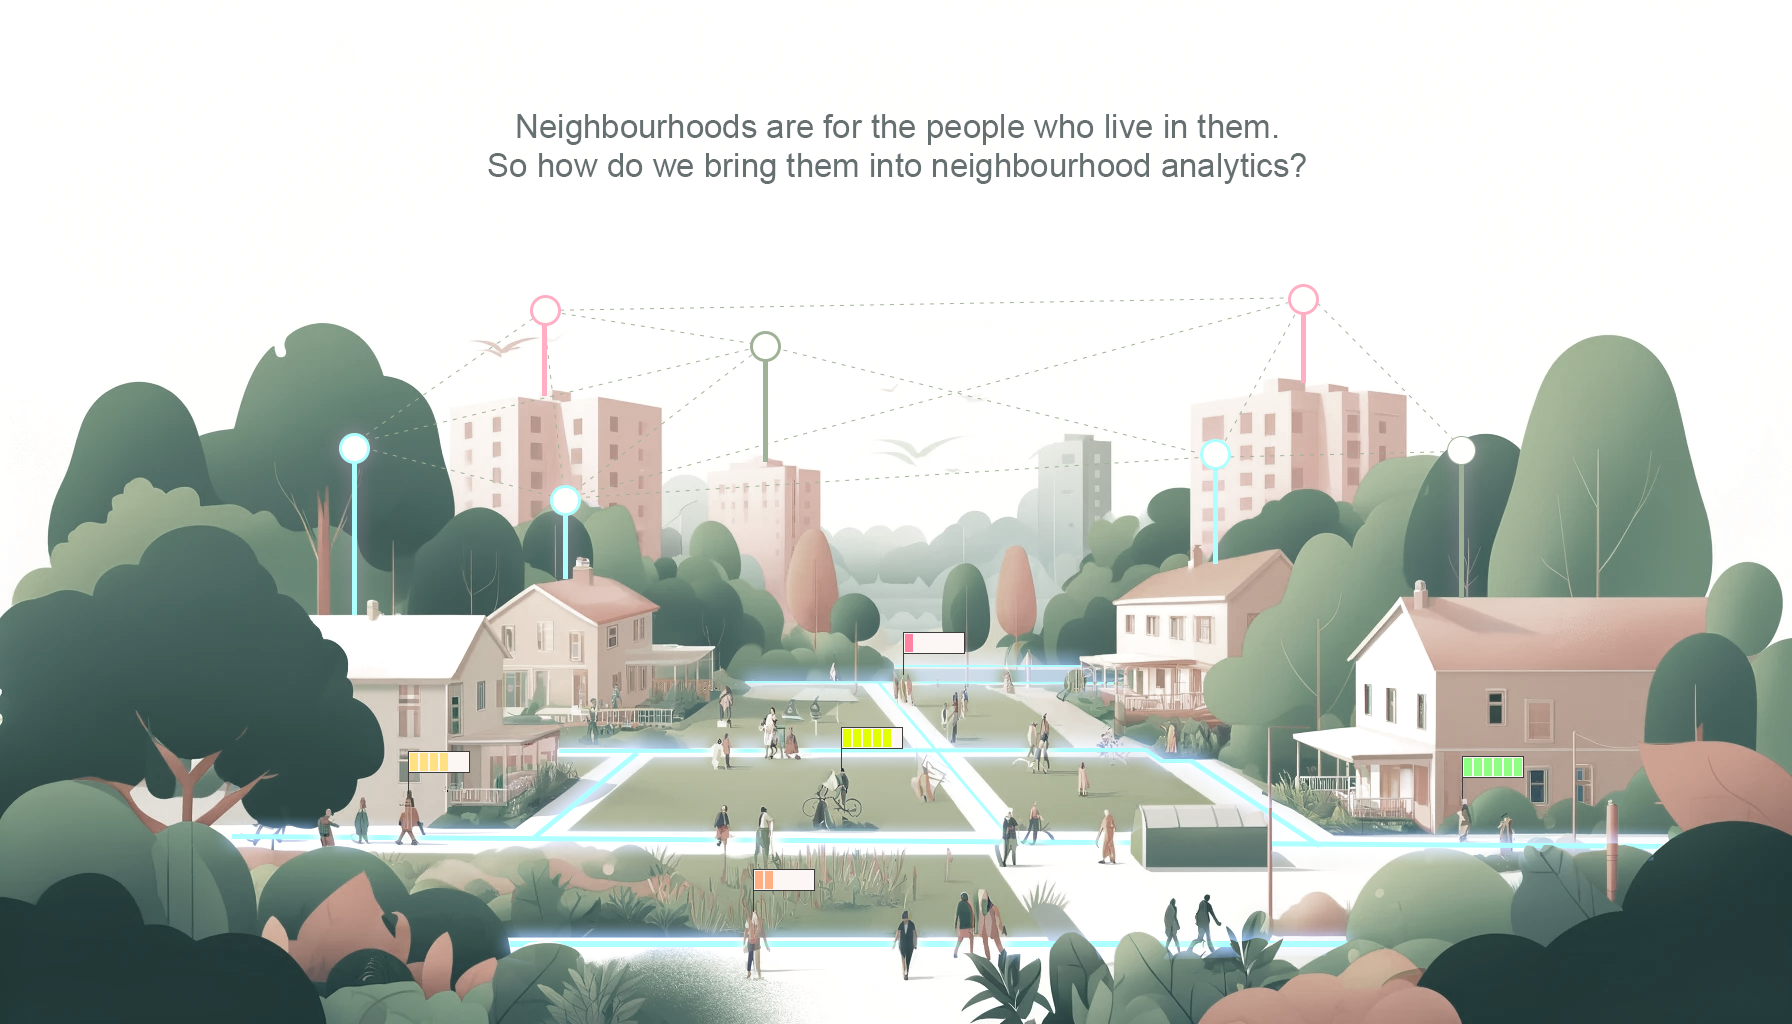
GAPSim stands for the Gothenburg Activity-based Population Simulator. GAPSim uses an artificial population that is a statistical representation of Gothenburg neighbourhoods, containing houses, households, and household members, to simulate how they move in their daily lives.
The main goal of GAPSim is to integrate the social dimension of neighbourhood planning into the analytical tools used by planners
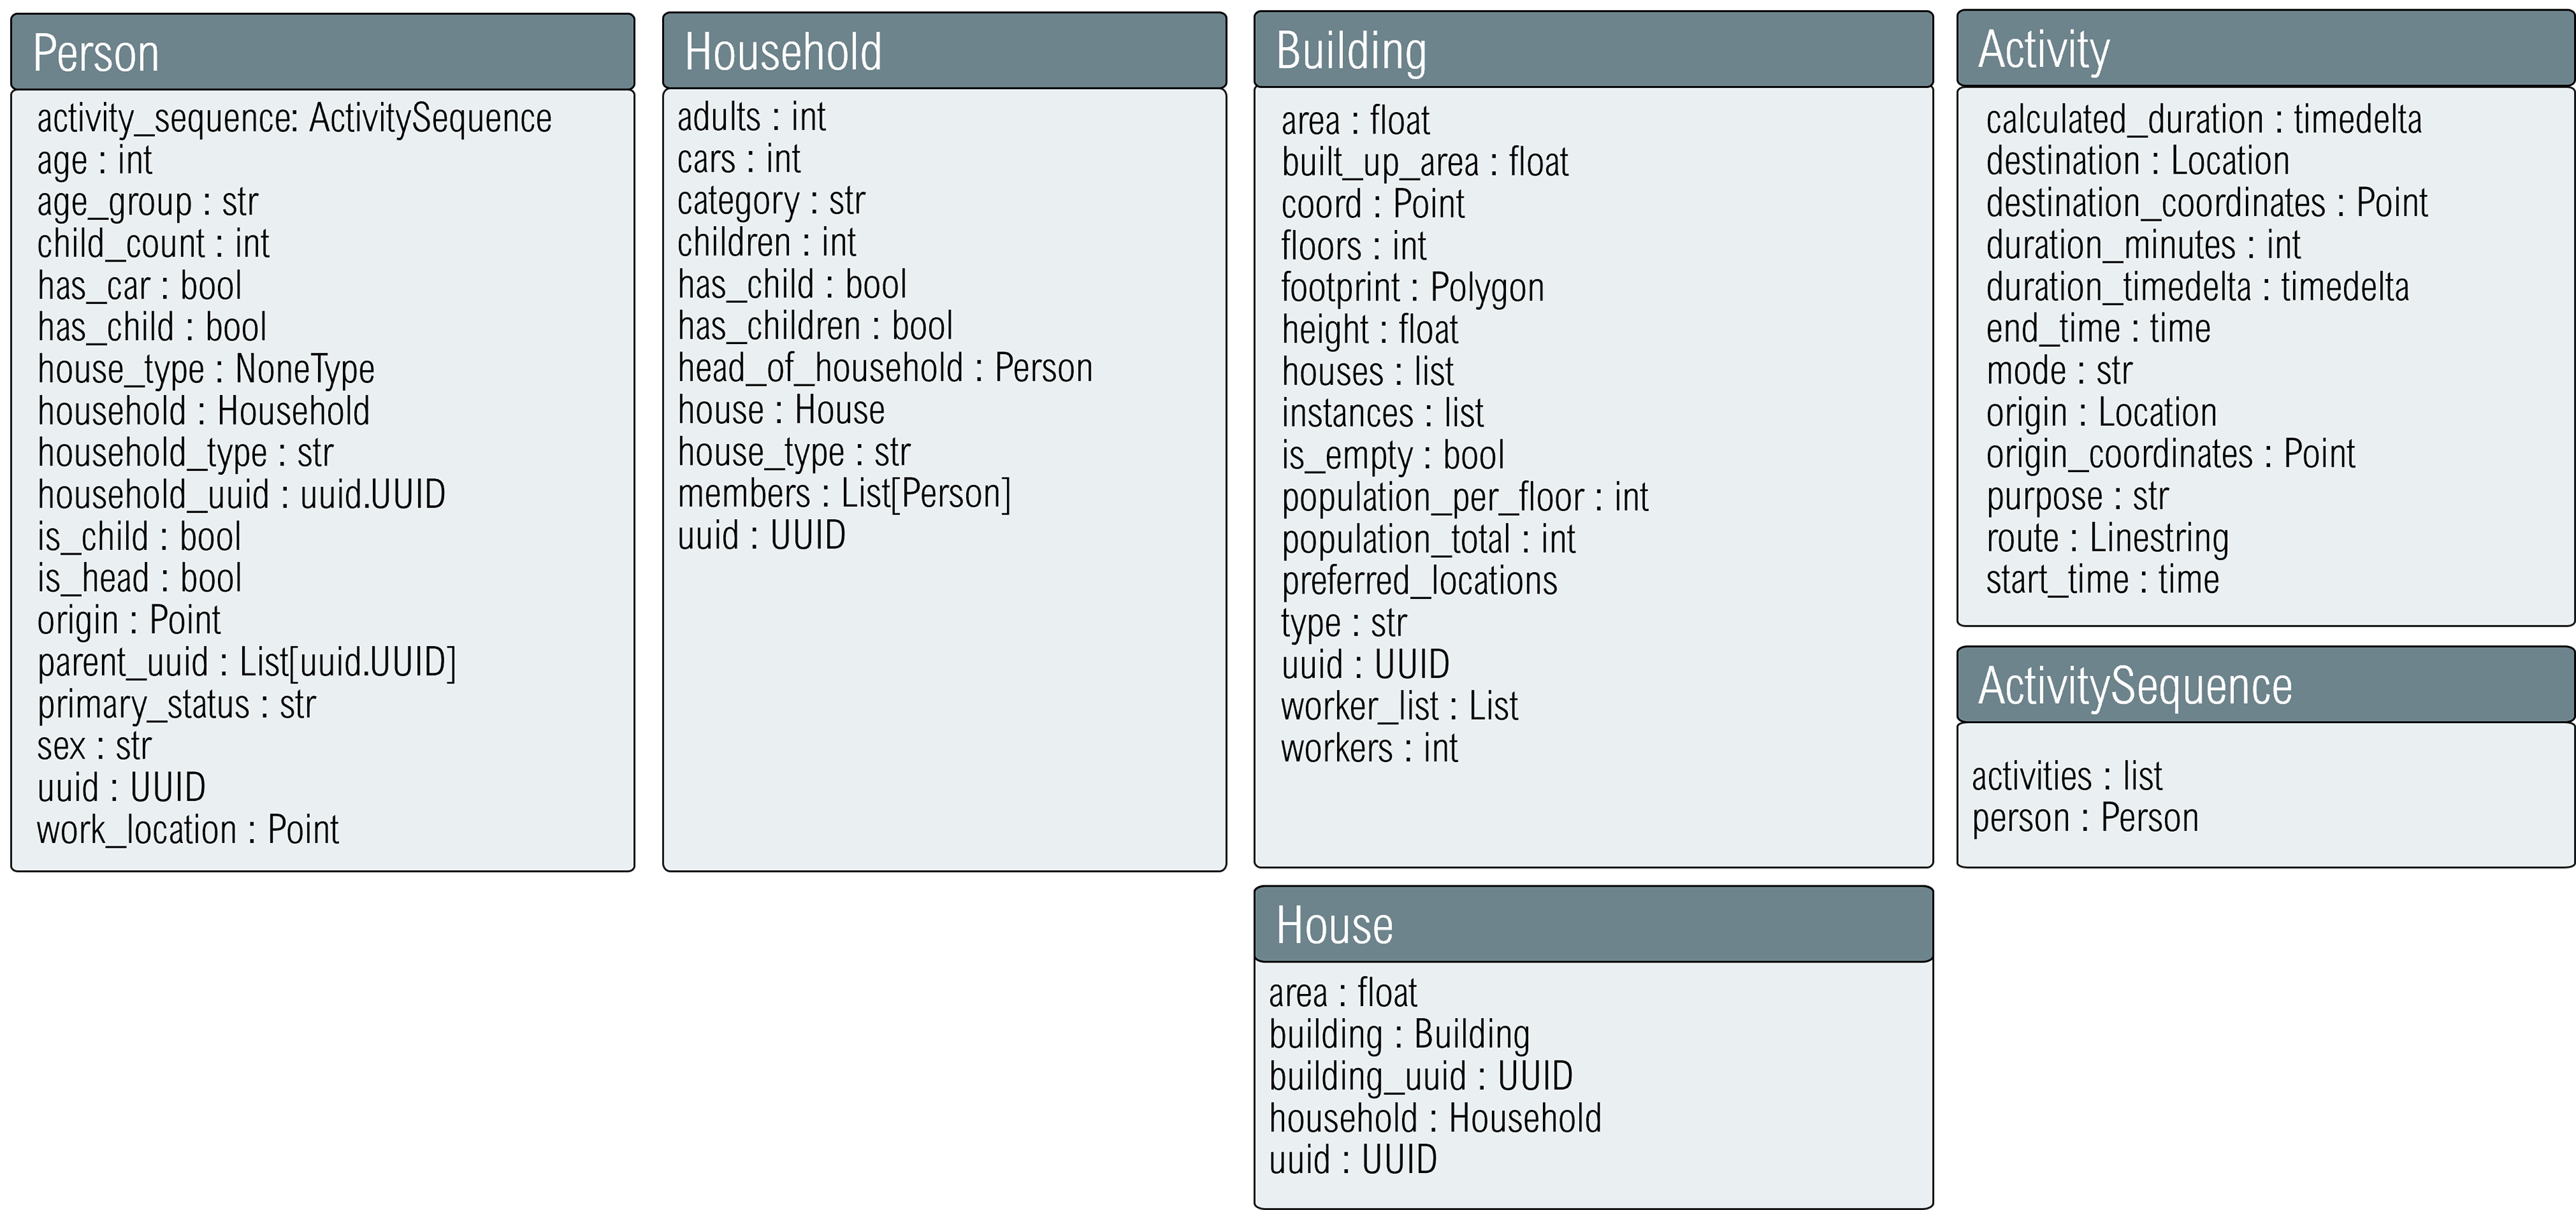
GAPSim model entities.
How does it work?
GAPSim creates a synthetic population of every neighbourhood and simulates activity demand using real-world destinations and mobility infrastructure.
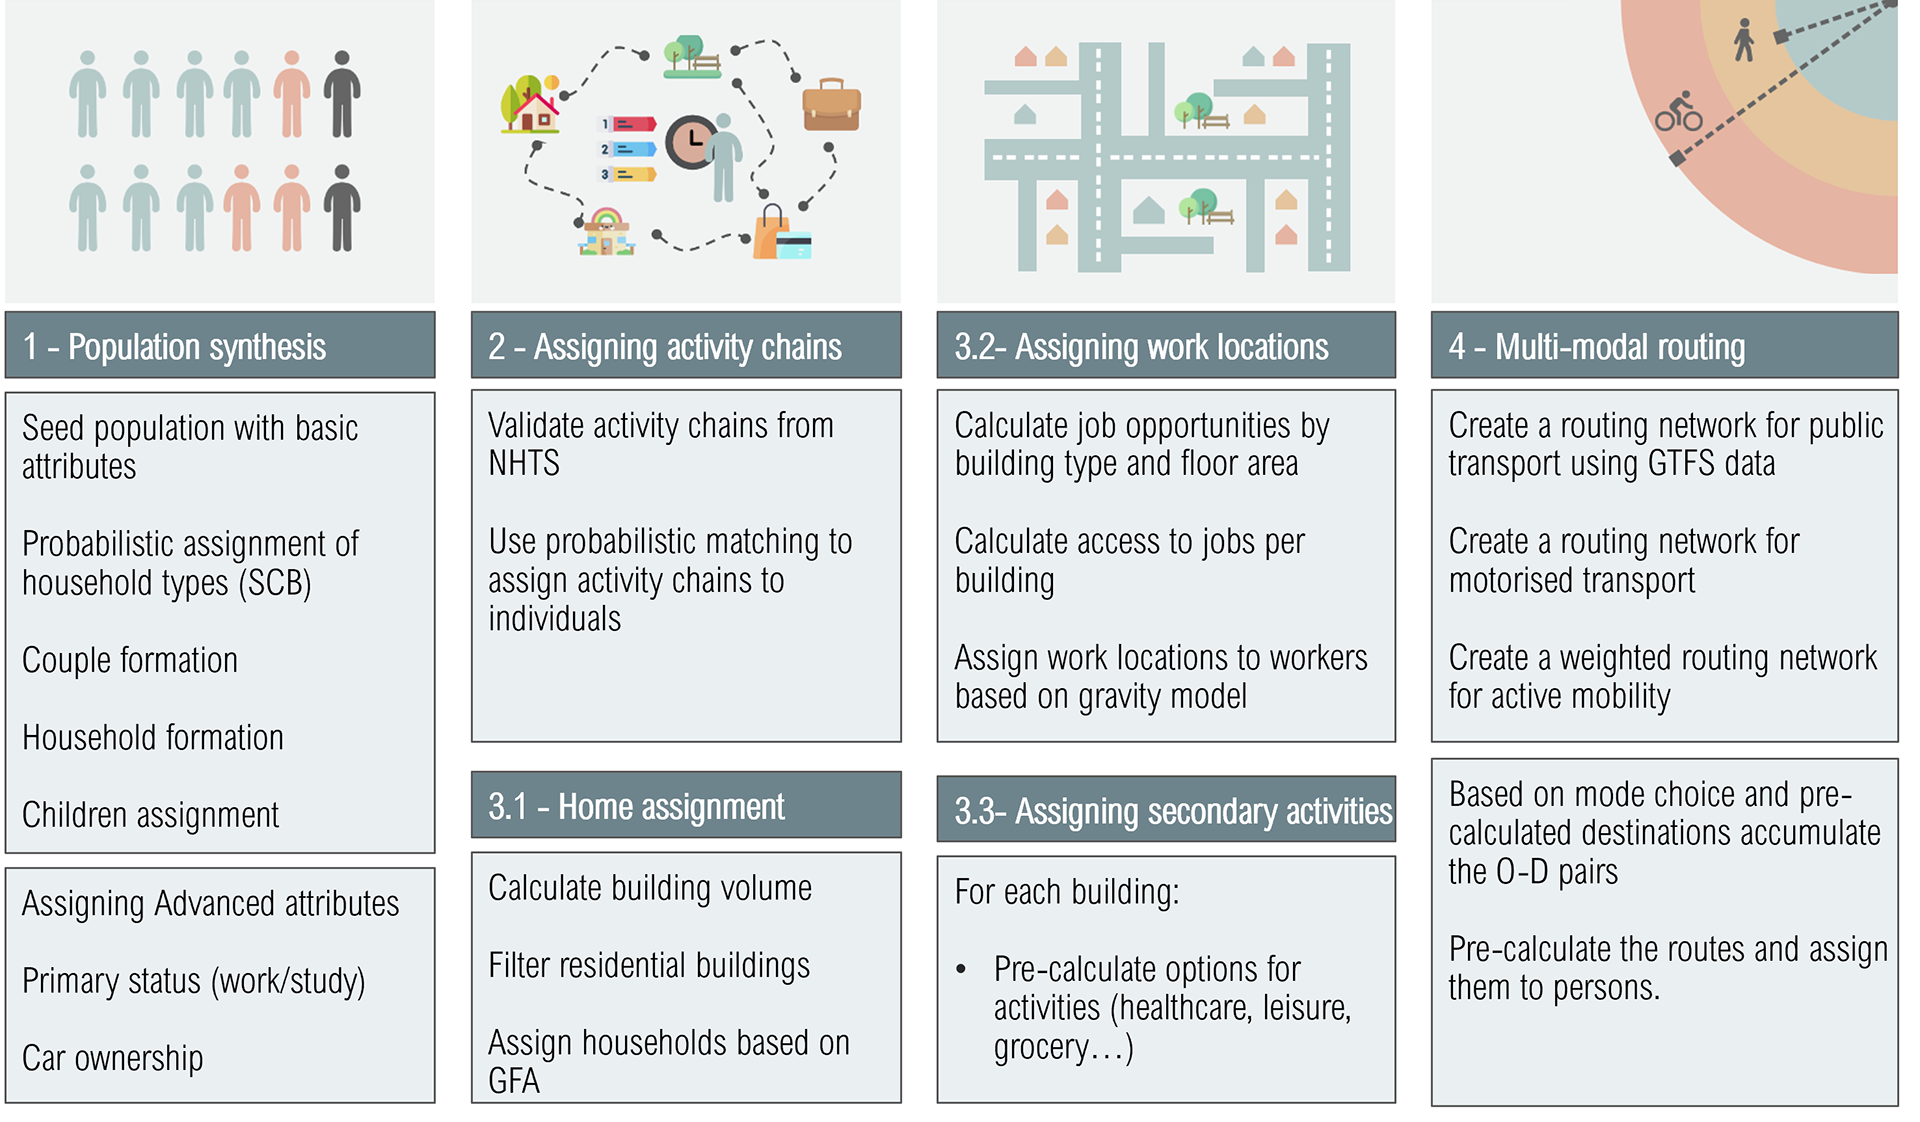
GAPSim simulation modules.
Why do we need new methods?
Existing accessibility analysis methods are too focused on locations.
We need to ask, "How much accessibility do residents have?"
We need to ask, "How much accessibility do residents have?"
By shifting from the spatial component to the individual component, planners can look into which demographic groups are disadvantaged in a planning scenario.
What does the model tell me?
The model simulates the movements of residents across the neighbourhood, taking into account their demographic characteristics and activity patterns.
Visualisation of trips simulated by GAPSim. The colours represent different modes of transport.
Quantifying equitable accessibility
Run multiple neighbourhood planning scenarios and evaluate Trip Completion Rates for all residents.

Scenario analysis of the neighbourhood plan for Länsmansgården neighbourhood in Gothenburg.
What is Trip Completion Rate
Trip Completion Rate is an indicator that evaluates the ratio of residents that can achieve their daily trips within a threshold of distance or time (think 15-minute cities).
Scenario comparison of 15-minute city concept in Länsmansgården.
Interested?
Check out these links
↓
📄 Data paper | 📊 Dataset | 📑 Model Paper | 📚 Documentation | 🐙 Github